Running an open WIFI hotspot in Germany

logo by The Tor Project

German legislation makes it difficult to run an open WIFI hotspot: Not only will the police possibly search your house if somebody decides to commit criminal acts using your connection, you will also be liable via Störerhaftung for copyright-“crime” committed using your connection.

Despite the difficulties I am a big fan of offering open WIFI, and there is a large Café right across the street from my house which does not offer free WIFI on their own. Recently it hit me: Why not just make it a TOR hotspot? TOR is a free, strong anonymizing network run by volunteers like me. Data is redirected over three encrypted computers, making it impossible to trace data back to the users computer. If the Internet connection from the open WIFI passes through TOR nobody’s gonna ring my doorbell if somebody misbehaves.

Said was nearly done: used a Raspberry PI 2 I had so far no use for and combined it with a high power usb-wifi-adapter from amazon. After that it was only a matter of following the onion pi tutorial (but opting to run hostapd without encryption).

If you decide to do the same please consider doing it like I do: run a middle relay or a bridge on your pi in parallel to the access point (unless you pay per traffic) to give back to the TOR network that you use. Middle relays and bridges do not allow others to access the web from your connection, so they are quite safe to run even on a home connection.


Raspberry Pi – Ultrasonic Distance Sensor part II

Using python for the ultrasonic distance sensor from part one of this post in a project I realized: It is still too slow. In my project I record high queality video using the raspberry pi camera at high resolution. That puts quite some load on the IO. As a result, the timing needed for the distance measurement becomes unreliable. Results vary by more than a meter shot-to shot (without changing the distance to the first obstacle). For higher timing accuracy I decided to do the distance measurement in C or C++. I stole some interrupt based c++ code from here. I modified it to have it measure continuously. The code does one measuerement every 25miliseconds and outputs the result as a binary float to stdout. The result looks like this (download here):

// code based on
// http://stackoverflow.com/questions/22580242/raspberrypi-g-ultrasonic-sensor-not-working
#include<iostream>
#include<wiringPi.h>
#include<errno.h>
#include<string.h>
#include<stdio.h>
#include<stdint.h>       //for uint32_t
using namespace std;
uint32_t time1=0,time2=0;
uint32_t time_diff=0;
float Range_cm=0;
volatile int flag=0;
void show_distance(void);

void myInterrupt(void) // Interrupt routine
 {                     // Called whenever the input pin toggles
 	uint32_t timeTemp=micros();
    if(flag==0) // first toggle? note the time
      {
            time1=timeTemp;
            flag=1;

      }
    else // second toggle? compute the distance
      {
            time2=timeTemp;
            flag=0;
            time_diff=time2-time1;
            Range_cm=time_diff/58.;
       }
  }
void show_distance()// writes the distance as a 
  {                 // binary float to stdout.
	fwrite(&Range_cm,sizeof(float),1,stdout); 
    cout.flush();
  }

int main(void)
  {
    if(wiringPiSetup()<0)
     {
       cout<<"wiringPiSetup failed !!\n";
     }
    pinMode(4,OUTPUT);
    pinMode(5,INPUT);
    pullUpDnControl(5,PUD_DOWN);
    if(wiringPiISR(5,INT_EDGE_BOTH,&myInterrupt) < 0)
            {
            cerr<<"interrupt error ["<<strerror (errno)<< "]:"<<errno<<endl;
            return 1;
            }

    while(1) // this loop starts a new measurement
    {        // every 2500 miliseconds
    	time1=0;
    	time2=0;
    	flag=0;
	digitalWrite(4,0);
	delayMicroseconds(1);
	digitalWrite(4,1);
	delayMicroseconds(10);
	digitalWrite(4,0);
	delayMicroseconds(25000);
	show_distance();
    }
    return 0;
 }

Now we just need to modify our python class to read the regularly arriving distance from the c-code instead of measuring it itsself. To do so I use the following code (download distanceMeter1.py):

# License GPL
import gps
import threading
import subprocess
import time
import numpy
import os
#from xdg.Menu import tmp
# culd be beefed up with code from here http://www.danmandle.com/blog/getting-gpsd-to-work-with-python/
#GPS
class distanceMeter(threading.Thread):
    # the init routine starts the compiled c-code
    # at high priority and initializes variables
    def __init__(self): 
        threading.Thread.__init__(self)
        self.distanceProcess = subprocess.Popen(['./distance'],stdout=subprocess.PIPE, bufsize=500,preexec_fn=lambda : os.nice(-19))
        self.running = True
        self.currentdistance=0.0
        self.lastFive=numpy.zeros(5)
        self.lastFiveValid=numpy.zeros(5)
        self.current=0
        self.currentValid=0
        print "created"
    # the run method of the thread is an infinite loop:
    #   whenever a distance measurement arrives
    #   the result is checked for validity (changes by more
    #   than 5 cm in 25msec are rejected as implausible for
    #   my means). Then mean and standard deviation of last
    #   five samples is computed.
    def run(self):
        print "starting loop"
        while self.running:
            # whenever new binary data comes in
            # put it into a numpy float and
            # process it.
            rawdata=self.distanceProcess.stdout.read(4)
            tmp=numpy.fromstring(rawdata,dtype="<f4")[-1] 
            if (numpy.abs(self.lastFive-tmp)<5).any():
                self.currentdistance=tmp
                self.lastFiveValid[self.currentValid%5]=tmp
                self.currentValid+=1
            self.lastFive[self.current%5]=tmp
            self.current+=1
    def stopController(self):
        self.running = False
        self.distanceProcess.send_signal(2)
        self.distanceProcess.kill()
    @property
    def distance(self):
        return numpy.mean(self.lastFiveValid)
    @property
    def deviation(self):
        return numpy.std(self.lastFiveValid)
# This is just to show how to use the the class above 
if __name__ == '__main__':
    test=distanceReader()
    test.start()
    for i in numpy.arange(1000):
        try:
            print test.distance
            time.sleep(.1)
            # you can put as much code as you like here,
            # test.distance will always contain the current
            # distance measurement, updated every 25msec.
        except KeyboardInterrupt:
            test.stopController()
            test.join()
            break

With this I get reasonable distance measurements even while recording high resolution high quality video using the camera.

Raspberry Pi – Ultrasonic distance sensor

For a current hobby project I need an ultrasonic distance sensor. They work by sending a short pulse of ultrasound and measuring the time $t$ it needs to get reflected back from the first obstacle. A nice introduction can be found here. The distance traveled by the sound $d$ can then be calculated from a measurement of $t$: multiply the speed of sound $v_\mathrm{sound}=340.29\frac{\mathrm m}{\mathrm s}$ by $d$. Divide by two to get the distance between the emitter and the reflecting object (the sound had to travel the distance twice to get there and back again).

$$d=\frac{v_\mathrm{sound}}{2}t$$

I want to measure distances with an accuracy of a few centimeters so the time measurement needs to be accurate by

$$\Delta t<\frac{2d}{v_\mathrm{sound}}$$

For one centimeter this amounts to about 60 $\mu\mathrm s$. This timing accuracy would be easy to achieve on a microcontroller where you can use hardware interrupts and have cycle-by-cycle accuracy of your timing (so at 1MHz you can get an accuracy of 1 microsecond). On a linux system your timing accuracy suffers from the fact that your measurement competes with other software for the CPU. Especially for an interpreted language like python, timing might get far worse than 60 $\mu\mathrm s$. The first solution I tried was this python code. No problem on an idle system. But as soon as you start recording HD video in parallel, your distance measurement starts to get quite noisy. It will be jumping by as much as half a meter from measurement to measurement).

For better timing accuracy one has to minimize delays between the incoming signal on the hardware pin and the recording of the time. With this goal I tried to modify the script to get an interrupt-based version. (An interrupt is a way of telling your machine, that when something happens it should automatically run a piece of code, allowing for decent timing in the presence of foreground processes.)

The result you can find here. It is object oriented and built such that you initialize the distance sensor and from then on it automatically updates the current distance regularly. It even calculates the standard deviation for you as an estimate of whether the measurement was noisy. (When the timing gets garbled up due to high load, you get a noisy measurement result). An example of how it can be used can be found in the main loop of the script.

You use the class like this:

import distanceMeter
distanceSensor=distanceMeter.distanceMeter()
distanceSensor.start()
#here is your code
#whenever you need the current distance you get it from the object
print "current distance is %0.3f, deviation %0.3f" % (distanceSensor.distance,distanceSensro.deviation)

#as the sensor runs in a thread you should tear it down properly:
distanceSensor.stopController()
distanceSensor.join()

Still this is not the end of it, even with the interrupt method I continue to get noisy distance data when the measurement code competes with other IO-heavy software on the PI, so stay tuned for an update with a C-based measurement module.

Update The post about the c-based module is here

Revisions of Latex documents

latexdiff example
latexdiff example output used on lebowski ipsum.

Like lots of other people I have come to like latexdiff to highlight changes between versions of latex documents. It takes two latex files as input and outputs a new latex file, in which changes are highlighted. I use a lot of pgf/tikz for graphics and latexdiff will destroy tikzpicture code. To avoid that I call latexdiff as (the hint how to do this came from stackexchange):

latexdiff -c PICTUREENV='(?:picture|tikzpicture|DIFnomarkup)[\\w\\d*@]*' VersionBefore.tex VersionAfter.tex > Diff.tex

Pyorbit and numpy

On Wednesday I started looking into py-orbit (the orbit tracking code for python). In order to quickly see what happens with the particles I wanted to be able to directly access the particle coordinates as a numpy array. The builtin c functions will only give you a pointer to the particle array and the builtin python functions give single particle coordinates. Accessing those for turn-by-turn diagnostics would give you a huge overhead of python code. This is not a flaw as everything time-critical in py-orbit is written on the C++ level. Nevertheless as a beginner and cython/python lover I would like to be able to use numpy for a fast view on the particle coordinates. For the direct access on a c array pointer via numpy I found help on a gist by Gael Varoquaux.

Unfortunately it turns out that py-orbit allocates memory in chunks of 10 particles. So the two dimensional array of particles is not a continuous chunk of memory and therefore there is, as I see it no easy way to access it as a numpy array. Nevertheless I think it is worthwhile to post this here so others do not waste time of this.

If you want it really badly I think the way to go is to modify py-orbit to allocate the memory for all particles at once in the beginning, but instead you can also just access the arrays in cython directly so I decided it was not worth the effort.

PDF-OCR: Sorting documents into searchable PDFs

I’v gotten rid of paper at home by installing an automatic scanner/OCR/document sorting system on based on an all-in-one printer-scanner and a raspberry pi.

For years I’ve been struggling to keep up with bureaucracy. I do really dislike everything to do with official papers. In most years that meant that I would just briefly read official letters and documents before putting them in a box. That summarizes my sorting system pretty well. Come the end of the year I would take a day or two to sort them into folders by category. I’ll never understand why, at least for those letters, we have not yet gone digital. In Germany the laws would have permitted that for more than 10 years.

Since I started my PhD I have been making an effort be more careful about my bureaucracy. I began to use the printer/scanner combination at work to archive a digital version of the most important documents in order to be able to find them quickly. But for most documents they still lived at home in a box. The main reason was: I was reluctant to bring a box of personal documents to work and scan them, even off-hours it seemed inappropriate.

Then my father told me that his all-in-one printer supposedly does OCR (optical character recognition) on documents he scans (unlike the machine at the office). OCR means that your PDF is not made of of images, as it is with most scanners. The computer also reconstructs the text from the images and allows you to search through the PDF and jump to a page as you can in PDFs that you generate from, say, Word documents. Searchable PDFs of course have the important quality of being searchable. In theory you don’t have to sort them at all.

In practice you may want some presorting, say by the company that sent you a letter. But that is something you can do easily once you have searchable PDFs.

When I bought the printer/scanner I paid attention that it offers the possibility to scan to a network drive without having a computer attached. This way it can directly deposit scanned documents on the hard disk of our network attached storage system (we’ve got a synology DS213 but really any NAS would be fine).

For the scanning I thought I’d use the other computer constantly running in our home, a Raspberry Pi whose tasks so far include logging of the temperature in different rooms and remote control of power outlets. At first I thought I’d have to do everything myself but soon found that somebody had already done the work: pypdfocr, a great python software by Virantha Ekanayake takes multipage-image-only PDFs as an input, disassembles them, runs them trough the open source tesseract OCR engine and puts them back together as conveniently searchable PDFs. Then it puts the PDFs into folders depending on configurable keywords (think “Invoice”, “Insurance”, “Tax”)

More than that, it can conveniently be installed from the python package index (PyPI) using the command

pip install pypdfocr

The first time running it on the Raspberry Pi though the output was unfortunately not searchable PDFs. In my case the reason was that the tesseract-version on the Raspberry Pi package repositories was either outdated or a modified version. The fix in my case was downloading tesseract from Google (they develop it) at google code and compiling it myself. The necessary steps are:

  1. download tesseract and unpack it on the raspberry pi

  2. run the setup and compilation from main folder of the source:
    ./configure
    make && sudo make install
    

    If your raspberry pi complains during the configuration/compilation that software or libraries are missing install them using the package manger. Pay attention that you might need the -dev version of the libraries.

On top of that I wanted to make sure that pypdfocr automatically scans all PDFs that go into the incoming folder on the NAS. To do that did the following:

    1. I mounted the documents directory from the nas on

/nfs/documents

    1. I instructed the scanner to scan into the documents directory, subfolder

paul

      on the NAS

    1. I wrote a short shell script that regularly checks for new PDFs and if it finds any runs

pypdfocr

#!/bin/sh
while sleep 60 #every minute
do
  for i in /nfs/documents/paul/*.pdf #for all pdfs in the folder
    do
    echo "found file " \$i #output name
    sleep 20 # wait for 20 seconds to make sure it is there
    pypdfocr \$i -f -v -c config.yaml # run pypdfocr.
  done
done

In theory, pypdfocr can do the last step itself (heck it can even upload the stuff to evernote if you’re into that). However depending on your system of network shares you can not always be sure that a file is correctly locked. Then it can happen that you start the conversion process on a file that is currently being written by the scanner. In my case the scanner usually takes less than 10 seconds to write a file. Therefore I wait for 20 seconds after I notice a new file. This way I am sure the file is fully on the NAS before starting the conversion.

The file config.yaml contains a dictionary of disk folders and corresponding keywords. If a the text in a scanned document matches a keyword, it automatically gets sorted into the folder on the disk.

Fixing missing ia32-libs on Ubuntu 13.10

Some commercial packages (namely AftershotPro) still depend on the old 32 bits compatibility libs for ubuntu. The package is obsolete for a long time now as the new ubuntu distributions are compatible with 32-bits stuff from the start (at least that’s what I gather from various sources).

For aftershot there were two approaches:

  1. Install the aftershot 32 bit deb version with dpkg -i –force-architecture. This approach is now obsolete as the 32-bits version is outdated
  2. Manually install ia32-libs from somewhere else and install aftershot 64 bit deb. This step is unnecessary as stated before.
  3. Force-install the aftershot 64 bit deb. This leads to complications later on as every time packages are installed the installer tries to fix the supposedly broken dependencies by removing aftershot.

To fix approach 3, I prepared an ia32-libs dummy package with no content. It does nothing, but it makes the apt system believe that you have the package installed, after which aftershot and any other packages that require ia32-libs run just fine.

You can download the package here: ia32-libs_1.0_all.deb

The commands used to prepare the package were:

equivs-control ia32-libs
# edit ia32-libs to give the package name 
# ia32-libs and a sensible description
equivs-build ia32-libs

Coding: python particle to grid interpolation

[latexpage]
In particle tracking simulations you often need to interpolate particles onto a grid in one or more dimensions. Recently I decided to write a linear particle-to-grid interpolation in one dimension in python.This is an educational introduction into interpolating particles onto a one-dimensional grid.

Interpolation of particles onto a grid

Particles are usually described by a vector of coordinates in an $ n$-dimensional phase space. Often people want to compute a density of particles along one of the coordinate axes. Let us first start with the example of particles in a two-dimensional space, they have coordinates $ (x,x’) $. A common question will be: What is the density of the particles projected on the $ x $ axis?

note: code blocks from here on are executed one after another in an ipython notebook. You can download the notebook here.

To answer the question you first have to think about: How do you compute the density? A builtin way in python/pylab is the histogram function.

%pylab inline
x=10*tan(random.random(1000000))/tan(1)
# Generate 1 Million particles
figure()
hist(x,bins=10) # Calculate the histogram
xlabel("x")
ylabel("number of matches")
show()

The histogram function computes the number of particles between the left and right edges of the bars respectively. We can also look at the data:

numbers,bins=histogram(x,bins=10)
print "there are %d particles with x between\
 %0.2f and %0.2f" % (numbers[0], bins[0],bins[1])

there are 154841 particles with x between 0.00 and 0.1

The histogram function does exactly this, count the number of particles between the edges of a bin. Visually the edges are represented by filling a bar between the left and the right edge up to a height proportional to the resulting number of particles.

Another way to look at this would be to say: the histogram function computes the density at the centers of the bins by attributing each particle to its nearest neighbouring bin. We could then compute a value for the density as follows:

numbers,bins=histogram(x,bins=10)
# compute the width of a bin
binwidth=bins[1]-bins[0]
# compute the positions of the centers of the bins
bincenters=(bins[1:]+bins[0:-1])/2
# plot the density (particles per length unit)
plot(bincenters,numbers/binwidth)

This looks nice and smooth, but you might say. But if you think about it, for a particle in the middle of two bins, say at the right edge of the first bin at 0.95, is it really justified to assume that it only contributes to the grid point at 0.5? It virtually has the same distance to the grid point at 1.5!
[latex]
\begin{figure}\begin{center}
\begin{tikzpicture}
\fill [red] (0.95,.15) circle (3pt);
\draw [line width=2pt] (0,0) — (11,0);
\foreach \x in {0,…,11}
{\draw [line width=2pt] (\x,0)–(\x,0.3);
}
\foreach \x in {0,…,10} {
\node () at ($(\x,-.3) + (0.5,0)$) {\x};
}
%\fill [red] (0.95,.15) circle (2pt);
\end{tikzpicture}\end{center}
\caption{A grid with one particle at 0.95}
\end{figure}
[/latex]

This problem can become even worse. Let us define point positions $$x_i=10(1-1/i)$$. Here see a figure with particles with $i$ between 10 and 25:

[latex]
\begin{figure}\begin{center}
\begin{tikzpicture}
\foreach \x in {10,…,25}{
\pgfmathparse{(10*(1-1.0/\x)-9)/.05833}
\fill [red] (\pgfmathresult,.15) circle (3pt);
}
\foreach \x in {0,1,…,10} {
\node () at ($(\x,-.3) + (0.5,0)$) {\x};
}
\draw [line width=2pt] (0,0) — (11,0);
\foreach \x in {0,…,11}
{\draw [line width=2pt] (\x,0)–(\x,0.3);
}
\end{tikzpicture}\end{center}
\caption{A grid with particles of decreasing spacing}
\end{figure}
[/latex]

You can see how the particle distance (which is inversely proportional to the intuitive density) changes smoothly. The density per bin can be calculated analytically to be $\rho(x)=\frac{x \delta}{(-10 + x)^2}$ with $\delta$ the bin width. Let us plot the point positions and the resulting histogram for $i$ between 10 and 25. The histogram however has a step-shape as you can see below and does not compare too well to the analytic result (grey vertical lines indicate particle positions, the green curve is the analytic particle density):

x=10*(1-1/numpy.arange(10,25.)) # the points
density=lambda x: (10/(10/(-10 + x) + (10/(-10 + x))**2))**(-1)*.05833
for i in x:
  axvline(i,color="grey",linewidth="1") # grey lines for the point positions
hist(x,bins=10) # histogram of point positions
plot(numpy.arange(9,9.6,.01),density(numpy.arange(9,9.6,.01))) # analytic density function
xlim(8.99,9.6)

You see how steppy the histogram looks when you compare it to the analytically calculated density? Maybe we can do better. If we think about the single particle from above again
[latex]
\begin{figure}\begin{center}
\begin{tikzpicture}
\fill [red] (0.95,.15) circle (3pt);
\draw [line width=2pt] (0,0) — (11,0);
\foreach \x in {0,…,11}
{\draw [line width=2pt] (\x,0)–(\x,0.3);
}
\foreach \x in {0,…,10} {
\node () at ($(\x,-.3) + (0.5,0)$) {\x};
}
%\fill [red] (0.95,.15) circle (2pt);
\end{tikzpicture}\end{center}
\caption{A grid with one particle at 0.95}
\end{figure}
[/latex]
how about we say: It should contribute to its neighbouring bins according to its distance to the bin center. There are the two bin centers at $x_1=0.5$ and $x_2=1.5$ neighbouring the particle. We should pay attention that the total amount of density created by the particle stays the same. Let us for the time being focus on the assumption that a particle only contributes to two bins. So let us zoom in on the particle and its two neighbouring bins:
[latex]
\begin{figure}\begin{center}
\begin{tikzpicture}
\fill [red] (2.85,.15) circle (7pt);
\draw [line width=2pt] (0,0) — (6,0);
\foreach \x in {0,3,6}
{\draw [line width=2pt] (\x,0)–(\x,0.3);
}
\foreach \x in {0,3} {
\draw [line width=2pt] ($(\x,0) + (1.5,0)$) –($(\x,-.3) + (1.5,0)$);
}
\node () at ($(0.5,-.7) + (1.5,0)$) {0.5$\delta$};
\node () at ($(3,-.7) + (1.5,0)$) {1.5$\delta$};

%\fill [red] (0.95,.15) circle (2pt);
\draw[line width=2pt,||] (2.85,.5) — (4.5,.5) node[above,pos=0.5]{0.55$\delta$};
\draw[line width=2pt,||] (1.5,.5) — (2.85,.5) node[above,pos=0.5]{0.45$\delta$};
\end{tikzpicture}\end{center}
\caption{A grid with one particle at 0.95}
\end{figure}
[/latex]
The easiest way to distribute the particle density between its neighbouring bins is now to just measure its distance $d_i$ to its neighbouring bins, in the example $d_1=0.45\delta,d_2=1-\frac{d_1}{\delta}=0.55\delta$ and add $1-d_i$ to the grid point $i$. This way we make sure that the particle number is conserved (the total number added to the grid is 1, as for the histogram). In our example, the particle contributes $\rho_1=.55, \rho_2=.45$ to the grid bins 1 and 2.

Now expressing this in python and adding the bin width to calculate a proper density we write a function pics2gridpy(particles, left, right, bins). The function is called with four arguments:

particles: the Array of coordinates
left: The left edge of the grid (also the zeroth grid point)
right: The right edge of the grid (no grid point here)
bins: the number of bins (including the one at the left edge)

def pics2gridpy(particles, left, right, bins):
    grid=numpy.zeros(bins,dtype=numpy.float64)
    binwidth=1.*(right-left)/bins
    invbinwidth=1/binwidth
    leftIndexF = 0.
    binPosition= 0.
    for i in range(particles.shape[0]):
        leftIndex=particles[i]
        (leftIndexF,binPosition)=divmod((particles[i]-left),binwidth)
        binPosition*=invbinwidth
        leftIndex=int(leftIndexF)
        grid[leftIndex % bins]+=1-binPosition
        grid[(leftIndex + 1) % bins]+=binPosition
    return numpy.array([numpy.arange(left,right,binwidth),grid])

Let’s try to run it on our example particles and again compare to the analytic density!

# because actually the method makes a circular grid, we need to add one bin
# to the left and right of the distribution
bins,density=pics2gridpy(x,min(x)-.05833333,max(x)+0.05833333,12)
plot(bins,density,label="density (grid)")
plot(numpy.arange(9,9.6,.01),density(numpy.arange(9,9.6,.01)),label="density (analytic)")
xlim(min(x),max(x)-0.05833)
pylab.legend(loc="upper left")

We see, this is much better. But one thing is notable: The spike for the bin at 9.0, where does it originate? In this region, the density of perticles per bin is smaller than one. Because of that you have to expect aliasing effects that can produce these spikes. In fact, normally you try to have at least a few tens of particles in the bins that matter to you because you want to have a good approximation of the real density. In our case we needed very few because we had a smooth distribution. In most cases however you sum random particles and therefore you expect some noisiness due to the random fluctuations of your distribution.

Now that we have the method let’s get an estimate of its performance for very many particles:

x=random.random(100000)
%timeit bins,density=pics2gridpy(x,0,1,100)

gives a time of 844 msec on my machine. The histogram however only takes 8.5msec. There has to be a way of optimizing this. Next post we will look at how fast we can make it using cython!


Backup strategy on untrusted FTP

Update: Before implementing this method you might want to look at duply which uses gpg to implement the same functionality but does not need large image files.

We own a server which is used to keep e-mail and other personal data off the commercial cloud. Partly because of paranoia, partly because of the enjoyment of maintaining our own server.

We run the server ourselves so we have to backup all the software and configuration to get timely recovery after catastrophic failure. If you do the same, depending on the availability you want you will probably be running on a hardware RAID. But: Even that can fail, be it through software failure fucking your file system good or through some bigger hardware blackout. If the server going down is home to your e-mail, your dropbox-equivalent and your website you want to be able to get it back up as quickly as possible.

For this goal, our hosting provider allows for 100 GB of backups on one of their machines. It is vastly less than the 3 Tb of RAID5-storage on our server, but roughly covers the amount of data really vital to operating the server. We’re talking mysql databases, mail boxes, config files, websites hosted etc.

The big caveat is that the 100Gb of free backup space can only be accessed through FTP. This means:

  1. It’s not encrypted; everything can be read by our hoster. Not really desireable when you just spent hours on end making your system as safe as possible with encrypted disks.
  2. It does not preserve file permissions.
  3. It is too slow for large amounts of files. (We tried to run rsync on a curlftpfs-mounted ecryptfs-overlaid FTP share and it was just not usable).

Creation of the encrypted disk image

We decided to do things differently: As a backup target we use a disk image file (~95Gb), one copy of which lives on the local disk of our server. This disk image is encrypted using cryptsetup. I used the following commands to create the disk image (they are needed only once)

 # create 95Gig file of zeros (takes time depending on disk speed)
dd if=/dev/zero of=/backupimage.dat BS=1M COUNT=95000
# format it as an encrypted disk image
cryptsetup luksFormat /backupimage.dat
# open a loopback device for said image
cryptsetup luksOpen /backupimage.dat backupvolume
# format the volume
mkfs.ext4 /dev/mapper/backupvolume
# make a directory for the "disk"
mkdir /backupvolume
mount /dev/mapper/backupvolume /backupvolume

Now the encrypted image is mounted in /backupvolume. You can toy around with it, write some data to it etc. When you’re done, you should unmount the volume and close the loopback device:

umount /backupvolume
cryptsetup luksClose backupvolume

The backup process

For the backup process I needed to automatize the process. Only automatic backups will be run regularly and only regularly running backups are good backups. To automatize, I need a foolproof way of starting and stopping the loopback device and uploading the data to the FTP server. For the time being I’m using three bash scripts:

1. Mount the encrypted backup volume

This script opens the loopback device and mounts the encrypted disk image to /backup. Note that the password for the crypted image is clear text. This is necessary because you want the backup to run automatically. Additionally, the script can only be read by root and once someone has root access to your server he can access all the data anyway.

#!/bin/bash
if ! [ -a /dev/mapper/backupvolume ] # make sure loopback is closed
  then
  echo "password" | cryptsetup luksOpen /backupimage.dat backupvolume
  if mount /dev/mapper/backupvolume /backupvolume/
    then
      echo mount successful
      exit 0
    else # if we cannot mount we should close the loopback
      cryptsetup luksClose backupvolume
      echo "had problems mounting closed cryptloop device"
      exit 200
    fi
  else # if we cannot even open the loopback there was an error
  echo "error"
  exit 200
fi

1.1. Back up

Now is the time you want to backup stuff to /backupvolume. Make sure you leave the directory after, otherwise the following will throw an error.

2. Unmount the encrypted backup volume

After backup you need to properly close the backup volume:

#!/bin/bash
if [ -a /dev/mapper/backupvolume ] #make sure there is a cryptoloop
  then
  if ! umount /backupvolume #try to unmount it
    then # throw error if fail
      echo "unable to unmount"
      exit 200
    else # otherwise go on and unhook the loopback
      if ! cryptsetup luksClose backupvolume
        then
          echo "luksClose failed"
          exit 200
        else
          exit 0
      fi
  fi
fi

3. Upload the backup disk image to the FTP server

Once you have backed up to your image, the image file on your needs to be sent to the backup location. In our case that is an FTP server and if you want to use this method of backing up you are likely in a similar situation. For uploading data we use the following script:

#!/bin/bash
HOST=<ftp-host>
USER=<username>
PASS=<password>
MACHINE=<name of the machine>
ftp -inv $HOST <<END >ftp.log
user $USER $PASS
put /backupimage.dat backupimage-$MACHINE.dat
bye
END
if fgrep "226 Transfer complete" ftp.log
   then exit 0
else
   echo "FTP upload failed"
   exit 200
fi

In the next chapter: How to use these three scripts to backup your data automatically and be informed via e-mail whenever something goes wrong.

Raspberry Pi – Animated temperature plot

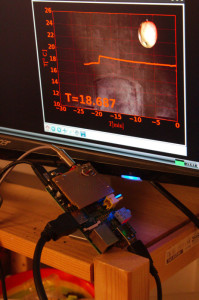
Raspberry pi with realtime temperature plot

For the Christmas party yesterday I was asked to bring a large pot. The contents were supposed to be, as is customary in Germany mulled wine (Glühwein). Mulled apple wine in this case. Besides a pot we needed a hotplate which was brought by a colleague. Well, having mulled wine on a hot plate has one risk: You easily run your wine so hot you lose all the precious alcoho l. With it, usually also the fruity part of the flavour is gone. Enter the raspberry pi. I still had a foodsafe temperature sensor from a sous-vide cooking experiment I did recently. A quick search on the internet told me that 65°C was the temperature to go for, warm enough to have the Glühwein feeling, cold enough to preserve alcohol and taste.

In sous vide cooking the task of the raspberry pi is usually exactly this: You put a temperature sensor into a water bath, have the pi heat it to a specific temperature and keep it there for several hours. To do so switch on and off the heating for the water bath in with an appropriate frequency. Some months ago I experimented with sous-vide cooking and used the code I found here. It can be used for keeping Glühwein temperature just as good.

But if you are anything like me, you will find Glühwein of the perfect temperature tasty but not very exciting. What was needed was a display of temperature over time, so the raspberry could show off how it was doing a good job. As prerequisites I installed a current version of python (2.7) and matplotlib on the pi. Before installing matplotlib (you can get a current version using pip) you should check that you have the dev packages and libraries for tk / gtk, otherwise the graphical frontend you need for the realtime display will not be built.

To have the reatime plot display I use two scripts:

  1. A script to periodically fetch the temperature from the temperature sensor (DS18B20) and store it in a file (in this case hardcoded to /home/pi/Desktop/test.txt
    from subprocess import Popen, PIPE, call
    import time
    import re
    import numpy
    def tempdata():
        # Replace 10-000801d31e81 with the address of your DS18B20
        pipe = Popen(["cat","/sys/bus/w1/devices/w1_bus_master1/10-000801d31e81/w1_slave"], stdout=PIPE)
        result = pipe.communicate()[0]
        result_list = result.split("=")
        temp_mC = int(result_list[-1])/1000. # temp in milliCelcius
        if(re.match(".*YES.*",result) and temp_mC!=85.000):
            return temp_mC
        else:
            print result
            print "invalid result"
            return tempdata()
    times=[]
    temps=[]
    while True:
            times.append(time.time())
            temps.append(tempdata())
            print temps[-1]
            numpy.savetxt("/home/pi/Desktop/test.txt",[times,temps])
            time.sleep(5)
    
  2. A script to plot the resulting temperature, nicely and christmassy, with dark picture background and red writing.
    font = {'family' : 'sans serif',
            'weight' : 'bold',
            'size'   : 22
    }
    import matplotlib
    import time
    matplotlib.rc('font', **font)
    matplotlib.use('TKagg') # if this fails install matplotlib AFTER installing tk. And install it using pip.
    
    import matplotlib.pyplot as plt
    import matplotlib.image 
    import numpy as np
    import matplotlib.animation as animation
    #from scipy.imread import imread
    img=matplotlib.image.imread("bg.png") # load background image. 
    limits=[-30,0,10,26] #define plot limits. In this case: -30 to 0 minutes, 10-26°C for the demo picture, there was no Glühwein.
    def main(): # everything in the beginning is just preparation of the plot
        fig = plt.figure(figsize=(8,6),tight_layout=True)
        fig.patch.set_facecolor('black')
        ax=fig.add_subplot(111,aspect=1111)
        for i in ax.spines.keys():
            print i
            ax.spines[i].set_color('red')
        ax.yaxis.label.set_color('red')
        ax.xaxis.label.set_color('red')
        ax.tick_params(axis='x',colors='red')
        ax.tick_params(axis='y',colors='red')
    
        plt.imshow(img, zorder=0, extent=limits,aspect='auto')
        plt.xlim((limits[0],limits[1]))
        plt.ylim((limits[2],limits[3]))
        plt.ylabel("T[$^0$C]")
        plt.xlabel("$T[\mathrm{min}]$")
        plt.grid(color="red")
        theText=plt.text(limits[0]+0.05*(limits[1]-limits[0]),limits[2]+0.05*(limits[3]-limits[2]),"T=$100^\circ$C",size=40,color="red",animated=True)
    
       # secondAxes.set_ylim((55,70))
        thePlot, = plt.plot([], [],color="red",linewidth=4,animated=True)
        plt.draw()
        ani = animation.FuncAnimation(fig, update_plot, frames=xrange(1000),
                                      fargs=(thePlot,theText),blit=True)
        # here we start the animation
        plt.show()
    
    def readRetry(): # reads data from the text file, retries if there are problems
        test=True
        while test:
            try: 
               x,y=np.genfromtxt("/home/pi/Desktop/test.txt")
               test=False
               except ValueError:
                    pass
            except Exception:
               pass
        return (x,y)        
    
    def update_plot(i, thePlot, theText): # this is the function that updates the plot for the "FuncAnimation"
        print i
        time.sleep(.1)
        x,y=readRetry()     
        thePlot.set_data((x-time.time())/60.,y)
        theText.set_text("T=%0.3f" % y[-1])
        return thePlot,theText
    #np.savetxt("test.txt",[[time.time(),time.time()-1000],[65,65]])
    main()
    

Now starting the scripts after one another (and adding your temperature sensor id to the first / your background picture to the second) you will get a nice animated temperature plot. If you press f in the window with the plot, it will go full screen.